Meet Horizon UI · 12/17: Inspect — Cross-Layer Query Power-Tools
This is the twelfth post in the Meet Horizon UI series, still in Act 3 — operate it. The Trace Explorer and Log Explorer both start the same way: you pick a layer, then a service, then you search. That’s the right shape when you’re already looking at a service. But sometimes you aren’t — you have a trace id and no idea which layer owns it, a failing service name from an alert, or a metric you just want to chart across everything. The Inspect family under Operate is built for exactly that: three cross-layer query power-tools that drop the layer-first step — and one of them has no per-layer equivalent at all.
Metrics inspect: the metric catalog, and the rule behind every number
SkyWalking computes a lot of metrics, and until now there was no way to simply see them all. Metrics inspect is that view. Its catalog drawer lists every metric the connected OAP computes — and groups them by the rule that defines them: the OAL files and MAL rule sets you met in the previous post. Filter by source (OAL, MAL·OTel, MAL·Telegraf, LAL→MAL), search by name, and read each metric’s value type and scope at a glance.
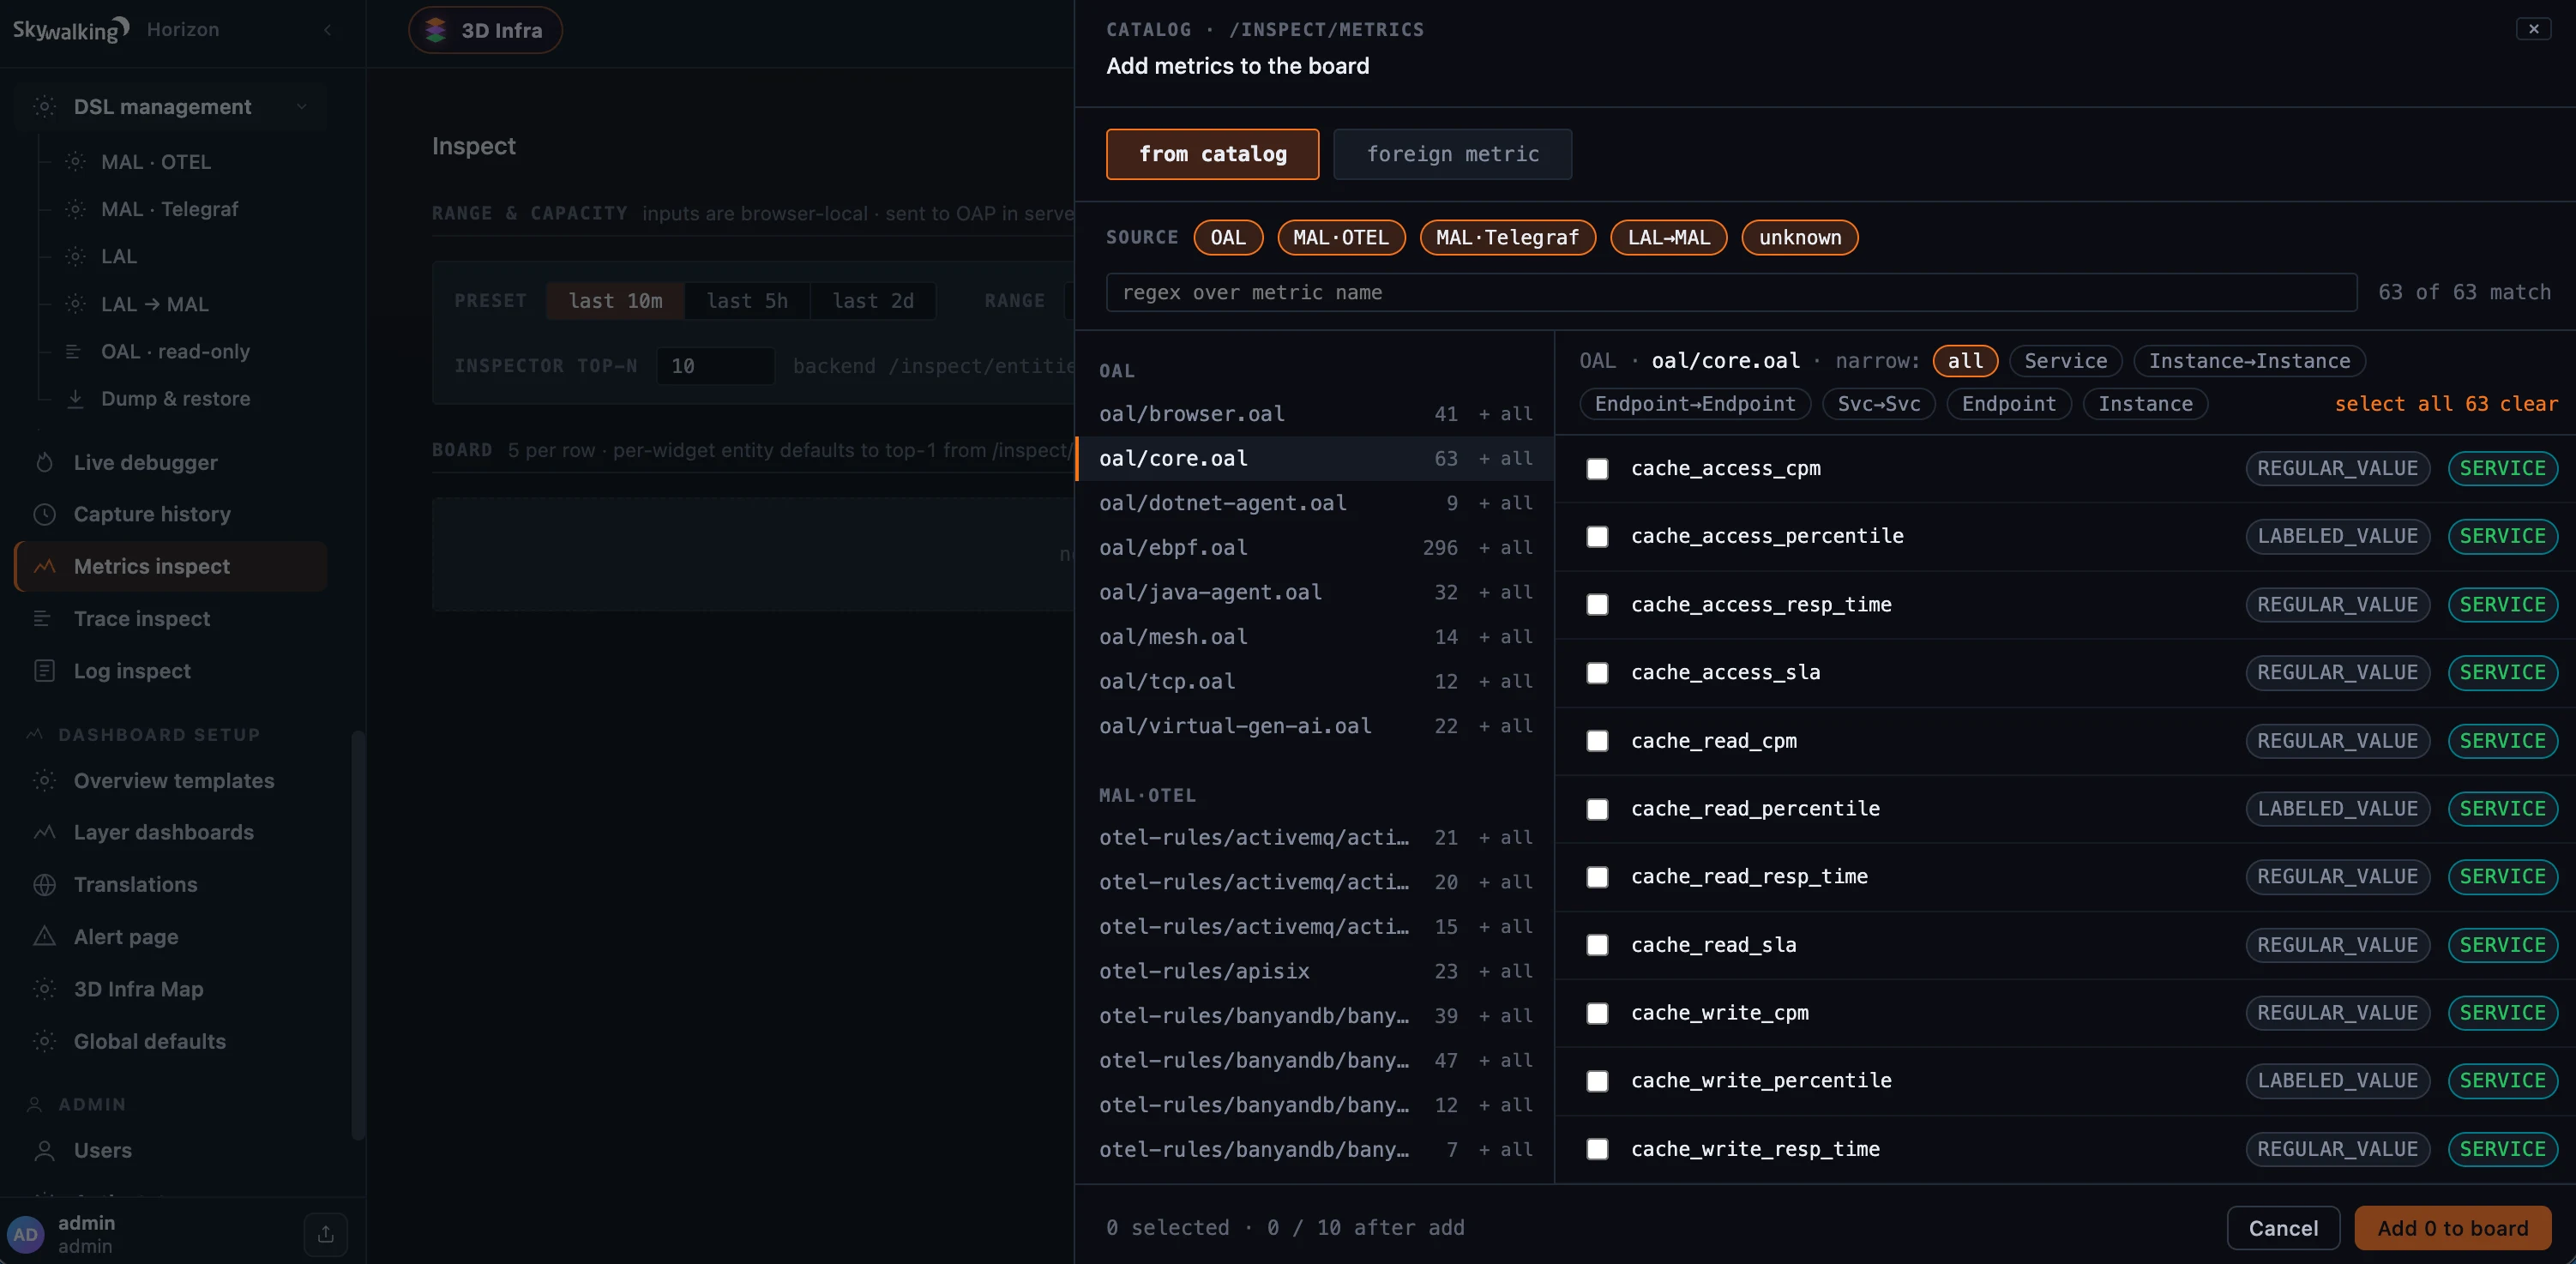 Figure 1: Metrics inspect’s catalog — every metric the OAP computes, grouped by the rule that defines it (the OAL files and MAL rule sets from DSL management), filterable by source and scope. Pick metrics onto the board.
Pick metrics from the catalog and they land on a board of charts, where you choose the entities to plot — a paginated top-N from OAP, or hand-entered ones — and read the values back as a line, bar, or area chart. Each widget carries its rule source and scope so you never lose the thread from “this number” to “the rule that produces it.” It’s an MQE scratchpad: the time range is browser-local but sent to OAP in server time, the board persists in your browser, and metrics that live only in shared storage (not defined on the connected OAP) can be added as foreign metrics.
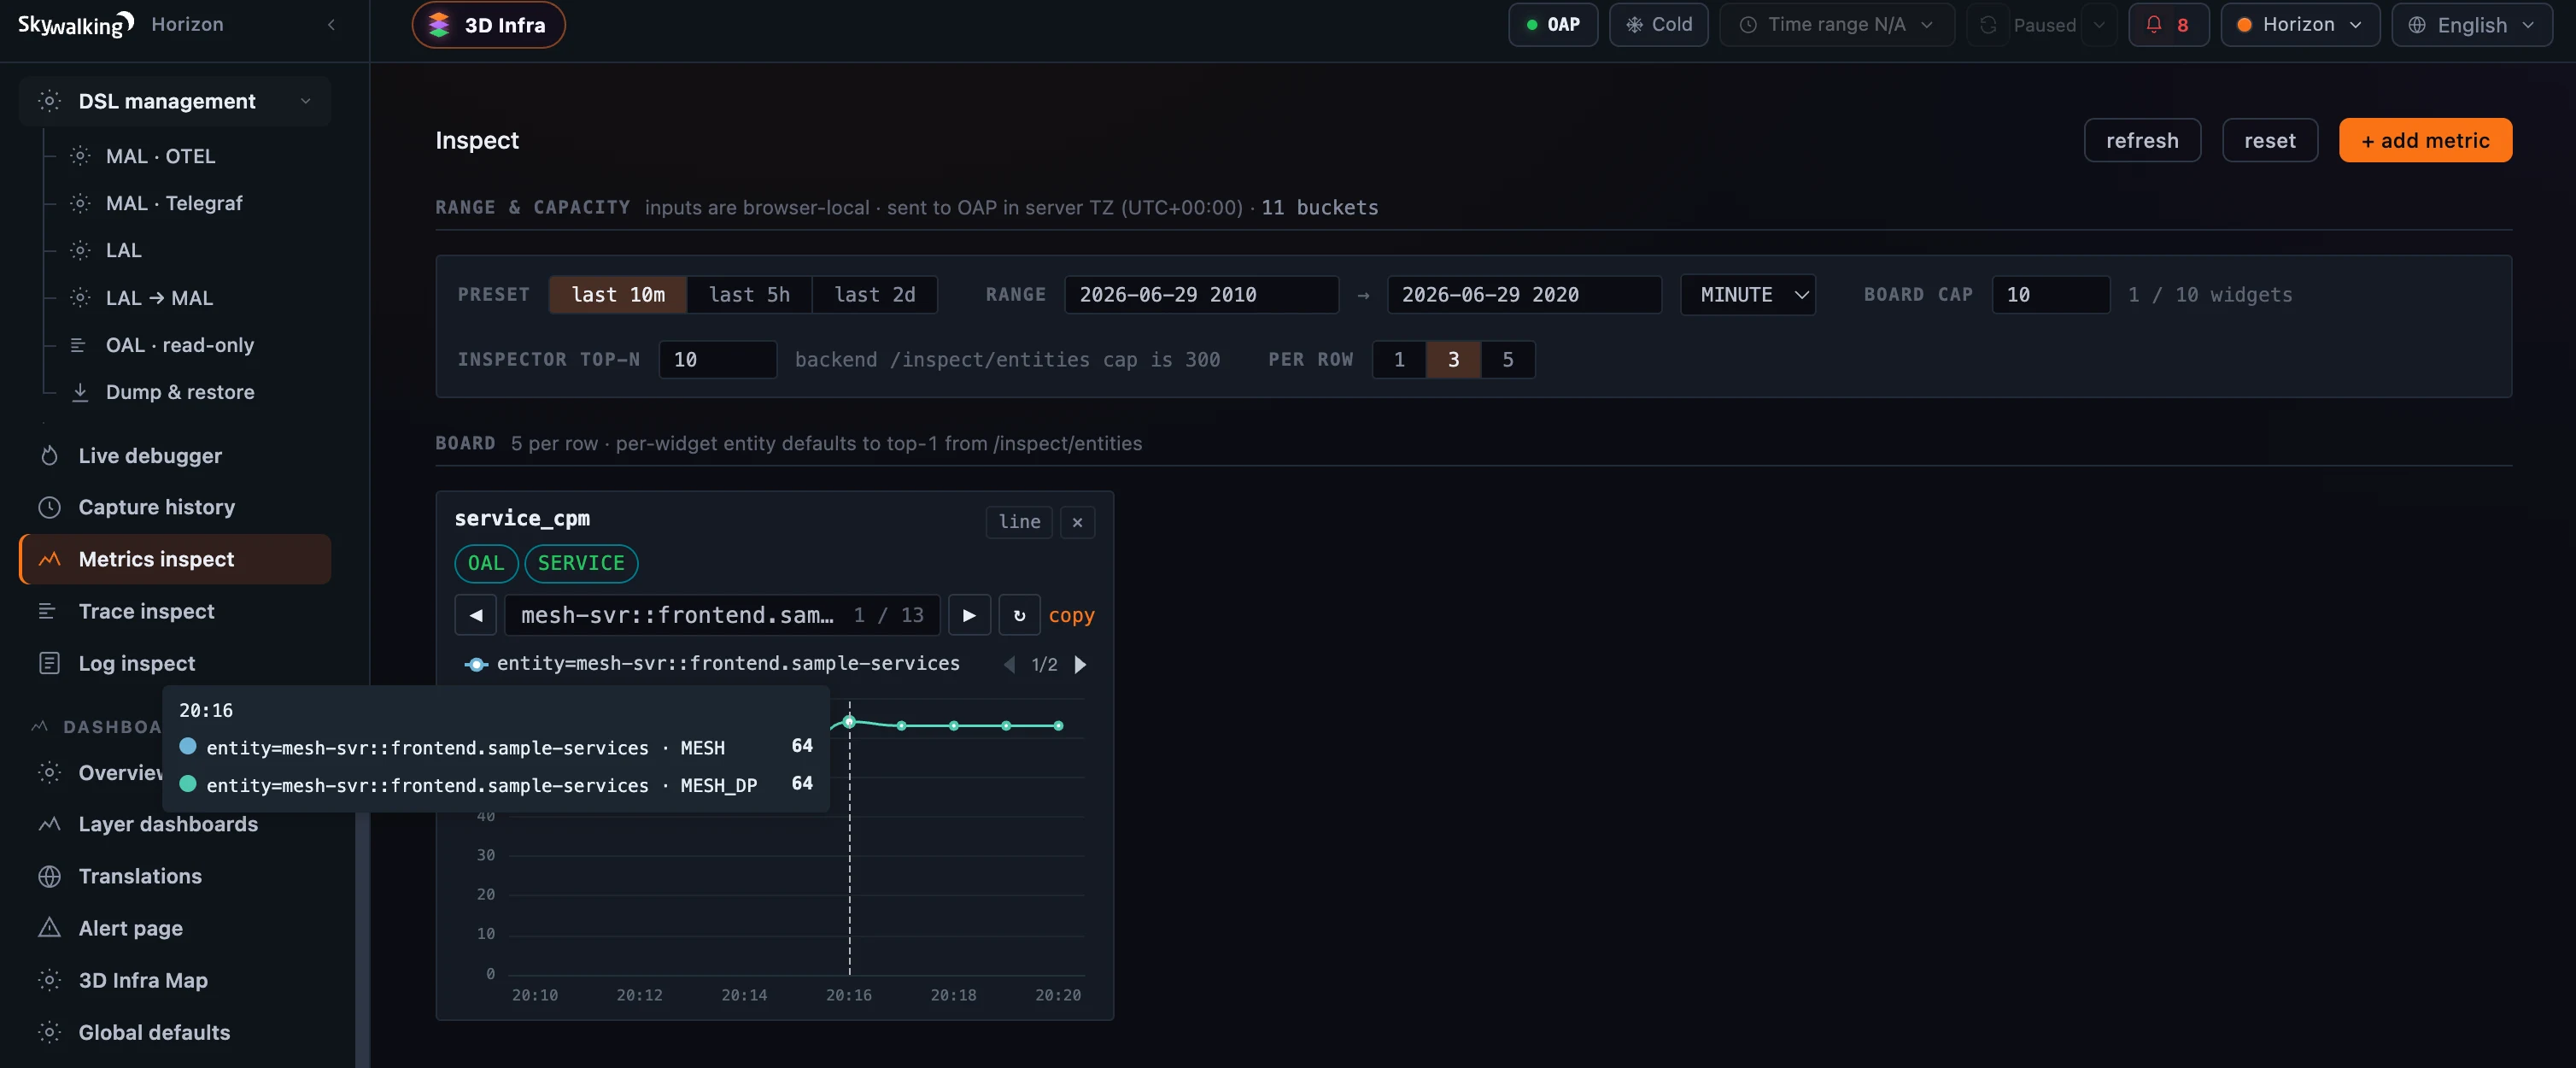 Figure 2: The board — chart any metric across entities; each widget keeps its rule source (OAL) and scope (Service), a per-widget entity paginator, and a browser-local range sent to OAP in server time.
Trace inspect: find a trace without picking a layer
Trace inspect is the Trace Explorer with the layer taken off. The Target is optional: pick a service through the layer → service → instance → endpoint cascade, type a name (with a real / conjectured flag), or leave it blank to query every service at once. Set the usual conditions — trace id, status, order, duration bounds, tags, window — and Run query. A resolved-query line spells out the exact call sent to OAP, and the results render as the same distribution scatter, trace list, and three-lens waterfall you already know — just not bound to any one layer.
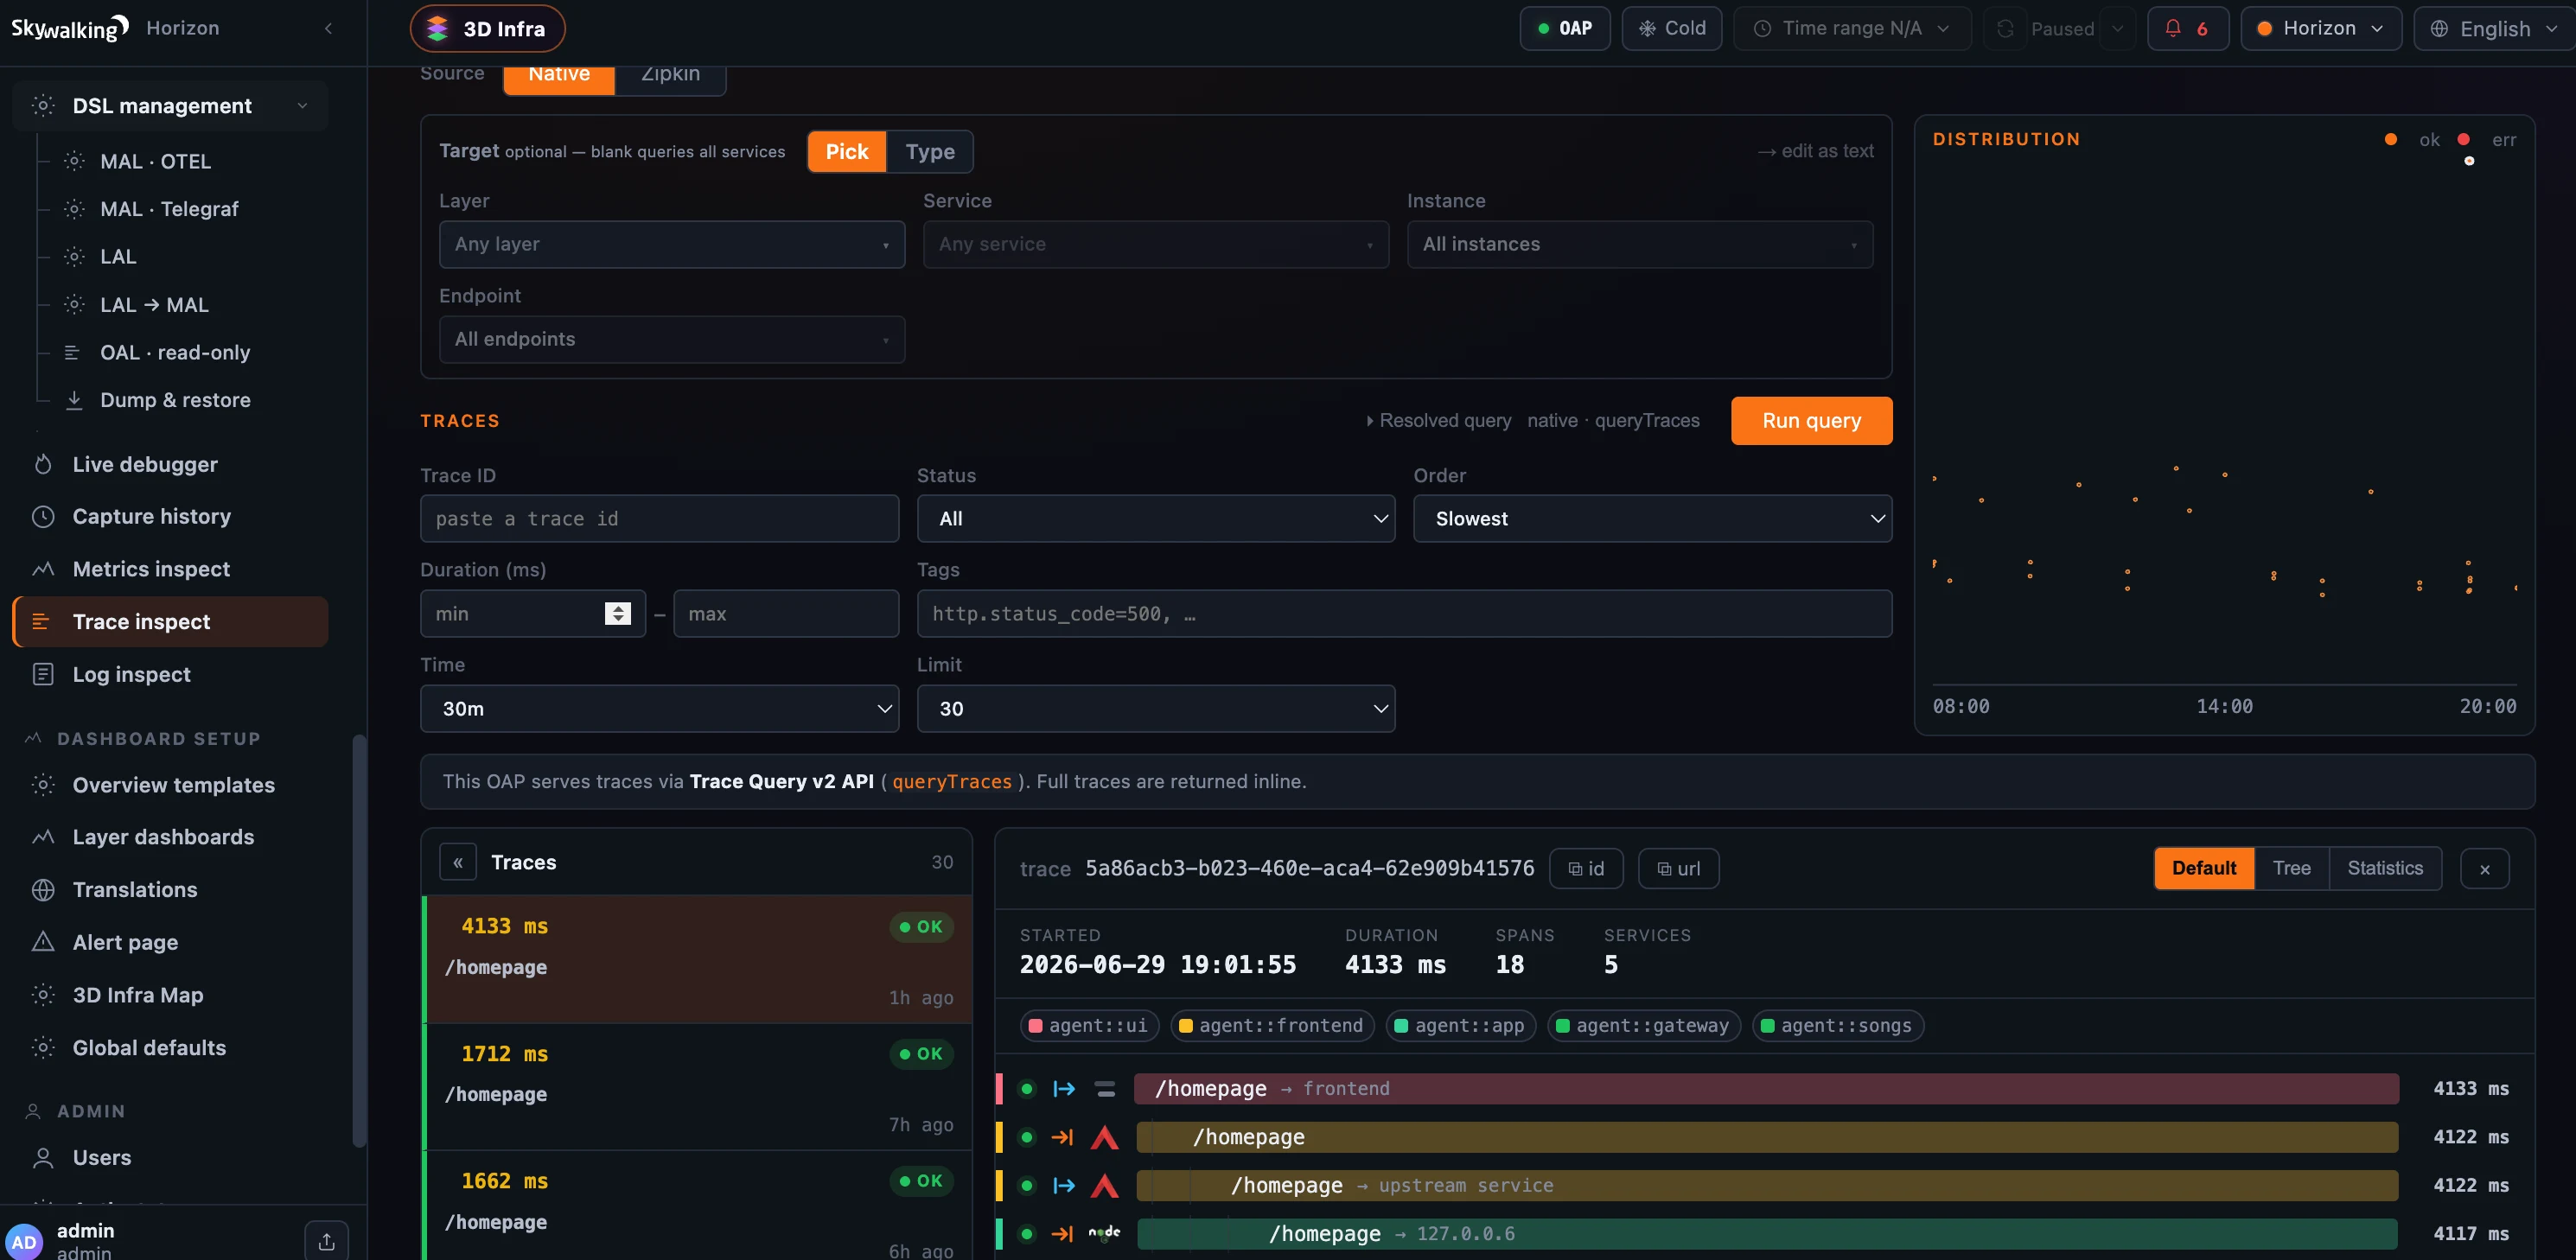 Figure 3: Trace inspect — layer-less: leave Target blank to query every service (or pick/type one), then Run query. Here one trace crosses five services (
agent::ui → frontend → app → gateway → songs); the resolved-query line shows the exact OAP call (native · queryTraces).
Log inspect: one query, three log sources
Log inspect does the same for logs — “query any service across layers, pick it, type its name, or leave it blank” — and folds three different log worlds into one place via a Source switch:
- Raw — the stored service logs, streamed across services with tag and trace-id conditions, each row opening the same payload popout as the per-layer Log Explorer;
- Browser — the BROWSER layer’s JS errors by category, with the same source-map de-obfuscation from the Browser Errors post;
- Kubernetes Pod logs — an on-demand live tail of a pod’s container logs, with Start / Pause and Include/Exclude regex filters, never persisted.
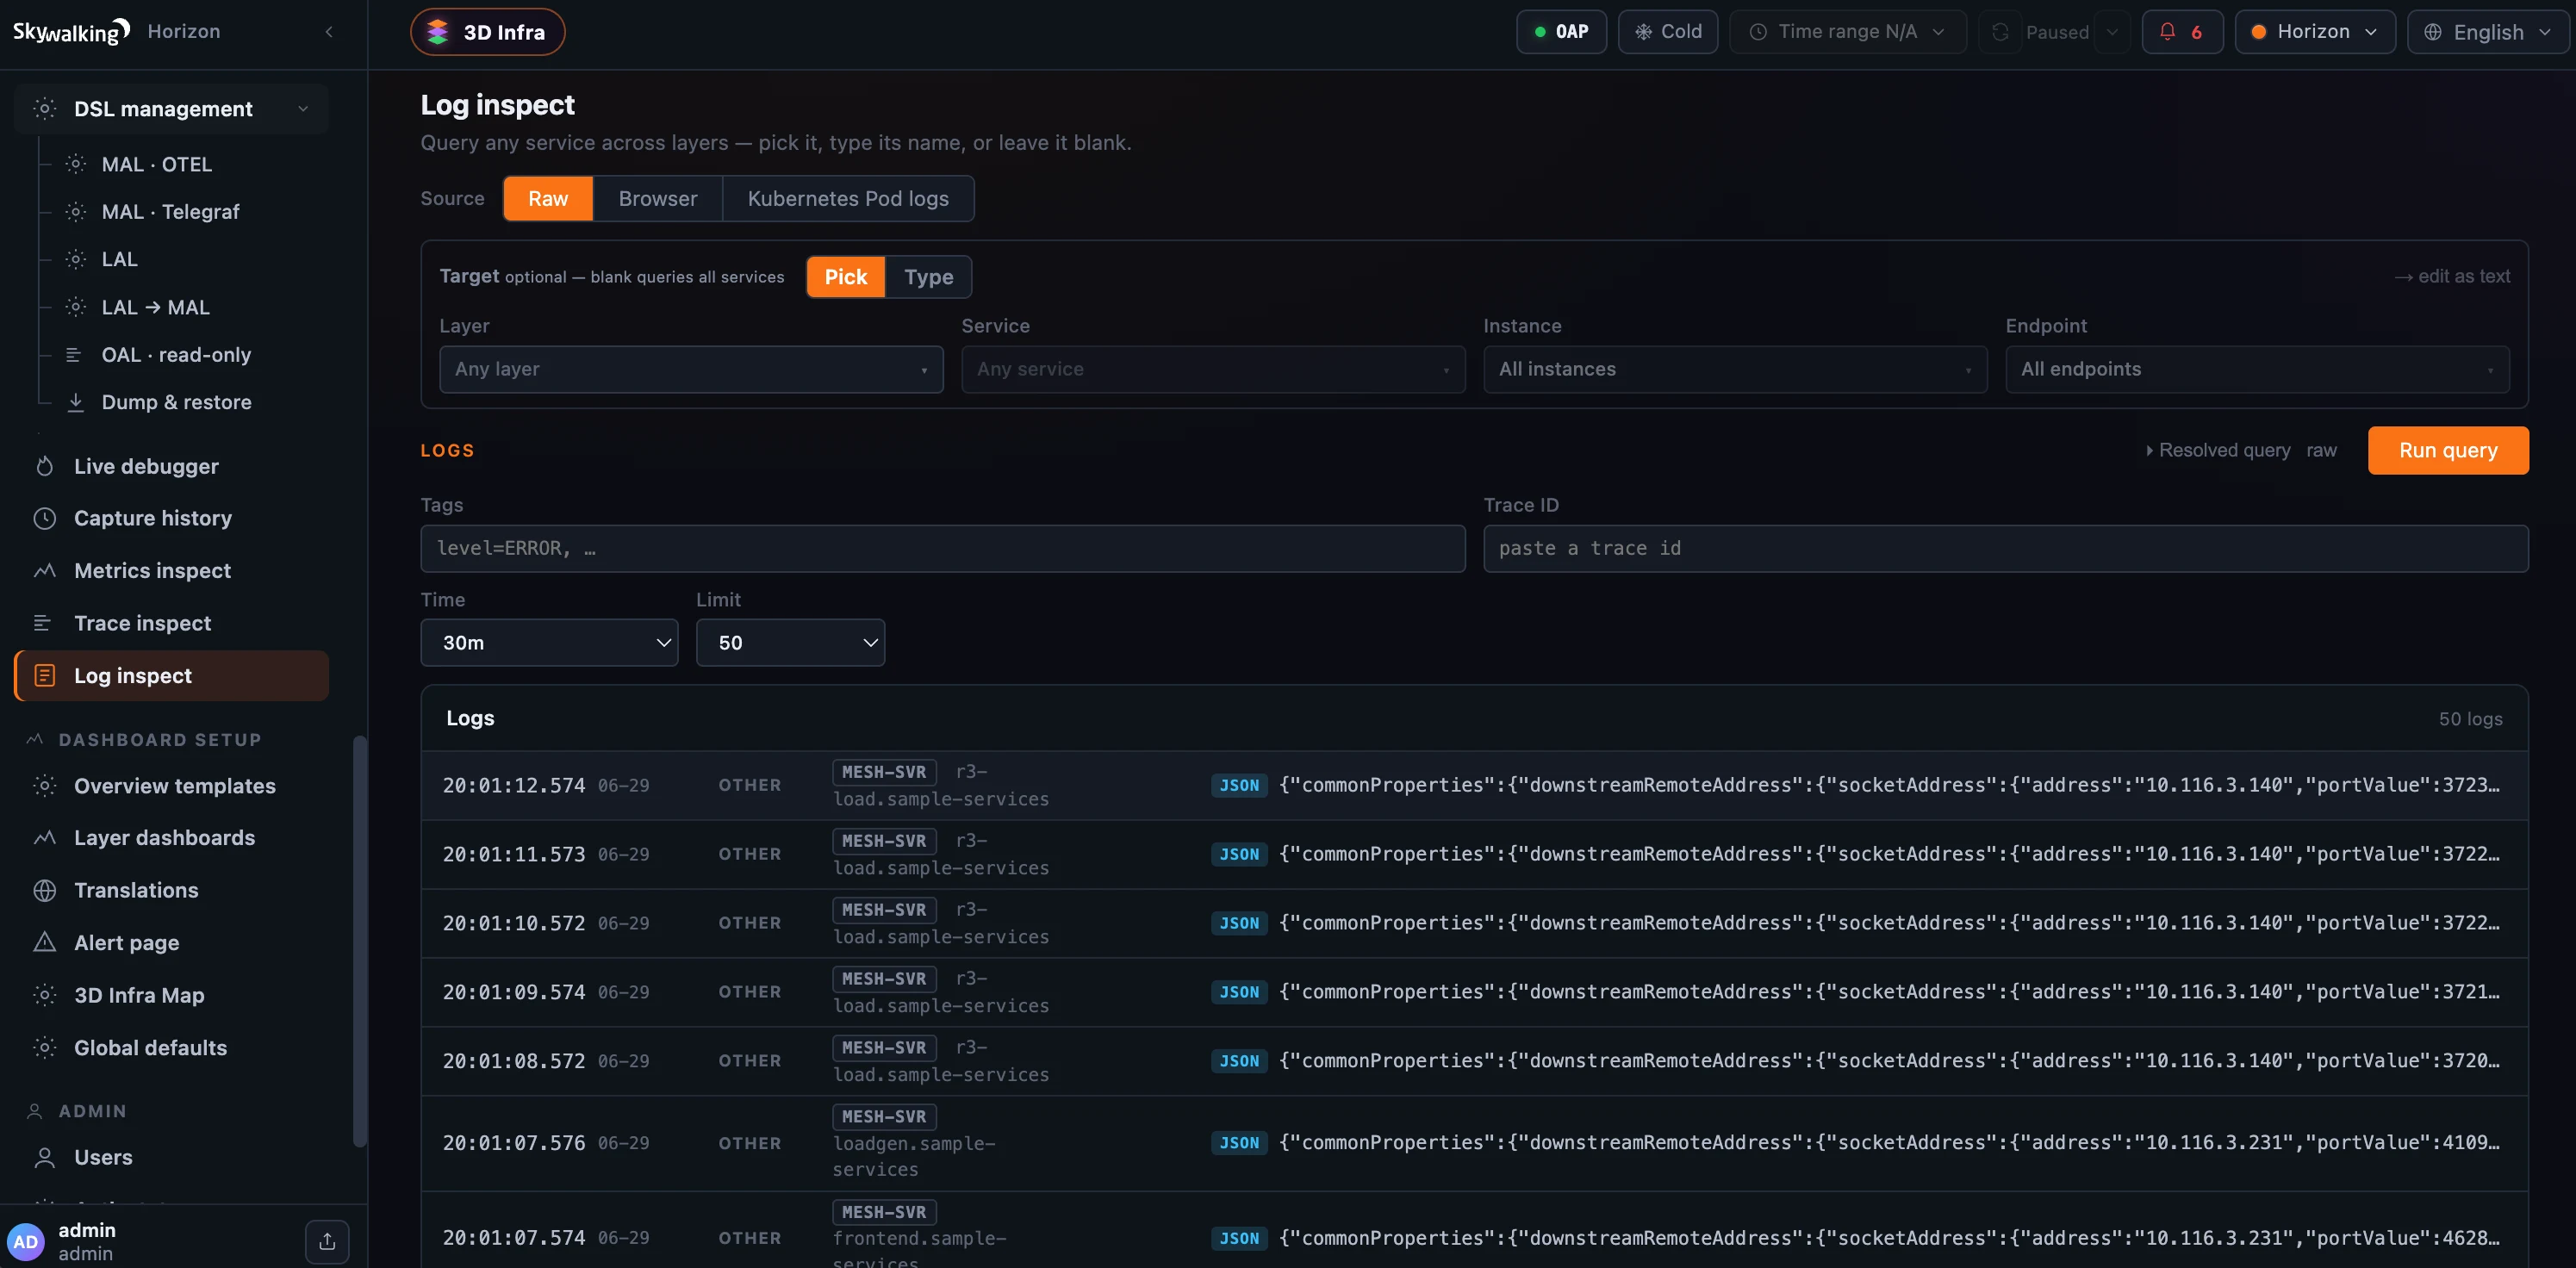 Figure 4: Log inspect — “query any service across layers, or leave it blank,” across three sources (Raw stored logs, Browser JS errors, Kubernetes Pod logs). Here raw logs stream from several services at once.
Where it runs
All three live under Operate and share one permission, inspect:read. They split on the backend, though. Trace inspect and Log inspect ride OAP’s standard query protocol — the same one the dashboards and per-layer explorers use — so they’re always on and work on any OAP, including 10.x. Metrics inspect is the exception: it reads OAP’s metric catalog and entity enumerator through the admin host’s inspect module, so it needs OAP 11; when that module is absent it shows a clear “set SW_INSPECT=default” banner instead of a broken page, while the other two keep working. Think of the trio as the cross-layer, Operate-side counterparts to the per-layer Trace and Log explorers — plus the metric catalog that finally answers “what does this backend even measure, and which rule measures it?”
Where to go next
For the field reference — the metric catalog, entity enumeration, foreign metrics, and MQE execution — see the Inspect docs.
Next up: Platform & Cluster Introspection — Cluster Status, OAP configuration, and data-retention, the last stop in Act 3 before we turn to governing and securing the console.